The Ultimate Guide to Notion Data Visualization Tools: Charts, Graphs, Lists and more
If you are a Notion user, you probably have tons of rows and columns of data in your database. In huge amounts of data lies hidden actionable insights for your business. In this article, we have talked about 11 data visualization tools that effortlessly create eye-catching charts, lists, and graphs, with just a few clicks. Whether you're tracking project progress, analyzing sales trends, or monitoring personal goals, visualizing your data makes it easier to understand and act upon. From pie charts that break down complex information to line graphs that reveal trends over time, these tools offer a range of visualization options to suit every need.
If you use Notion to manage important business data like timelines, strategies, reports, schedules, or any internal workflows, it will be valuable over time to derive insights from it. This applies not only to business data but also to personal information. Many people share data in Notion by adding pictures or screenshots of charts and graphs. But what if you could make these visuals interactive right on your Notion pages?
Despite the useful information contained in your Notion databases, there are no native charts or summary widgets available, preventing you from visualizing and pulling rich insights from your data.
In this article, we explore 11 no-code data visualization tools that can transform your Notion database tables into eye-catching charts, lists, and graphs – all with just a few clicks.
These tools can help you create slick, engaging, easy-to-understand data visualizations and embed them into Notion pages to keep context and data in one place and make your work stand out. Let’s get started!
The 11 best data visualization tools for Notion
NotionApps for converting databases into beautiful list-based apps
ChartBase for starting out with a template as a beginner
ChartBrick for quick configuration
Notion.vip for populating your charts with Google Sheets
Nochart for automatically creating charts using AI
Treendly for embeddable trend charts
NoteForms for custom database views
Data Jumbo for visualizing heavy databases
Rows for building reports from Notion databases in a spreadsheet
Columns for working with multiple types of data, especially time series
Grid for interactive calculators and dashboards combined from multiple data sources
What factors we consider when choosing these tools
Visualizations are an excellent way to simplify data communication. Whether you're presenting to colleagues, clients, or stakeholders, visual representations make it easier to engage your audience. Here are some key points we kept in mind while crafting this list for you:
No-code. All the data visualization tools selected are user-friendly, enabling you to create and customize visualizations without any coding skills. This ensures that users of all technical backgrounds can easily manage and modify their visualizations.
Integration. These tools seamlessly integrate with Notion, allowing you to effortlessly embed your visualizations into any Notion page. Connect your Notion account to access your tables and databases and turn them into charts.
Easy to use. These tools are designed with simplicity in mind, ensuring an intuitive and user-friendly experience. Create stunning visualizations effortlessly without wasting time or effort.
Customization. With these tools, you have full control over the appearance of your charts. Select from a range of chart types such as bar graphs, line charts, and pie charts. Personalize your charts with your own branding and color scheme.
Security. Ensuring the safety of users' data and privacy is a top priority. The tools do not store any user data, and they only have access to the tables users decide to share with them.
Quick comparison and deep-dive
Tool Name
Best For
Standout Features
Pricing
NotionApps
Converting databases into beautiful list-based apps
User-specific data for increased security; responsive
Free plan available; Paid plan from $25/mo
ChartBase
Starting out with a template as a beginner
Cached charts for faster loading; real-time updates
Free for 1 chart; Paid plan from $3/mo
ChartBrick
Quick configuration
8 chart types; great customer support
Free for 3 charts; Paid plan from $8.99/mo
Notion.Vip
Populating charts with Google Sheets
Ad-ons like Google Analytics; setup can be done directly from the homepage
Free plan
Nochart
Automatically creating charts using AI
Automatic suggestions; ordering & filtering
Free for 2 charts; Paid plan from $9.99/mo
Treendly
Embeddable trend charts
New curated trends; forecasting trends
Free with limited features; Paid plan from $49/mo
NoteForms
Custom database views
Custom database views; hide sensitive info
1 free view; Paid plan from $20/mo
Data Jumbo
Visualizing heavy databases
Advanced features; supports heavy databases
Free for 3 charts; Paid plan starts from $5/mo
Rows
Building reports from Notion databases in a spreadsheet
AI co-pilot; creates more than charts like large tables, calculators
Free plan available; Paid plan starts from $15/mo
Columns
Working with multiple types of data, especially time series
Handle multiple types of data; AI-assisted
Free plan available; Paid plan starts from $15/mo
Grid
Interactive calculators and dashboards combined from multiple data sources
AI chart assistant; combines data from multiple sources in Notion
7 days free trial; Paid plan starts from $49/mo
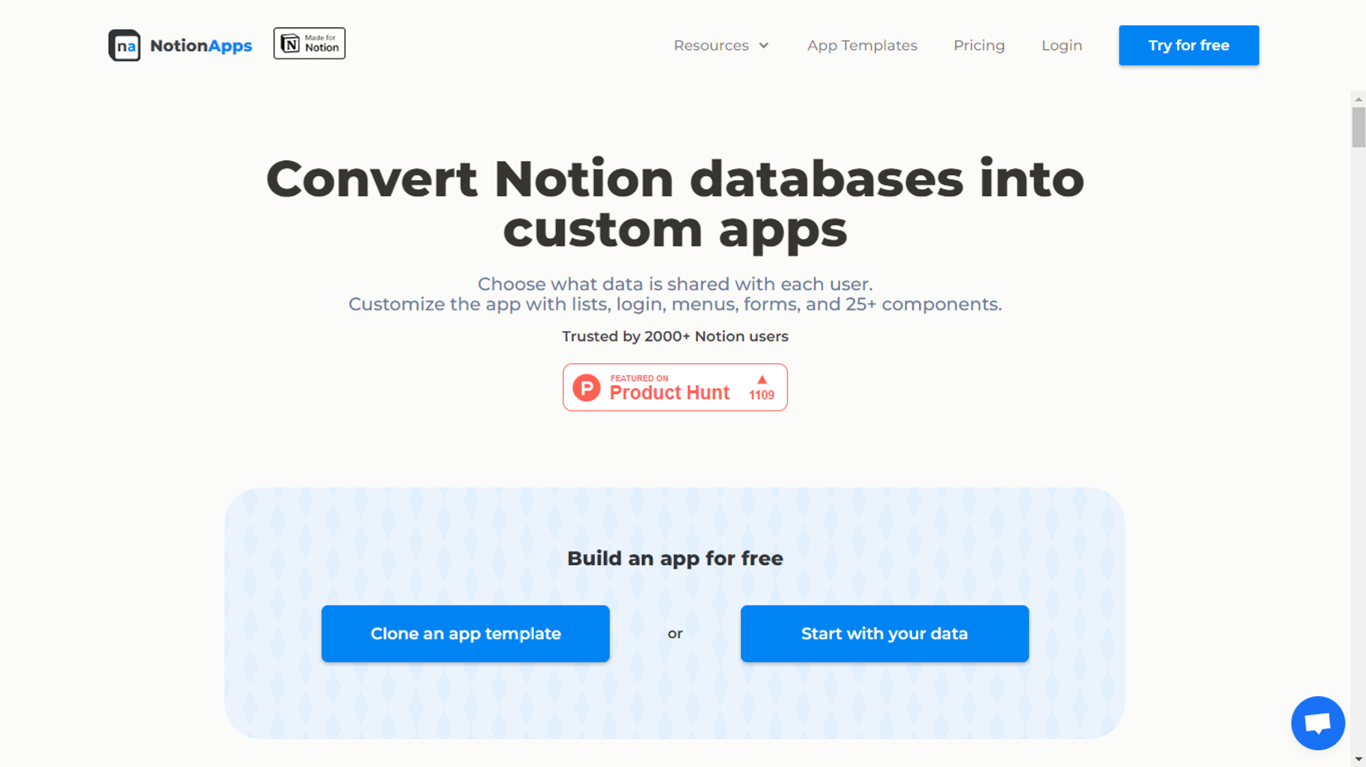
NotionApps
NotionApps converts databases into beautiful list-based apps with row-level access. Utilizing the app builder, you can customize these lists with various features to enhance data visibility and accessibility.
By utilizing list screens like "View Items" and "Update Items," you can effectively access and manipulate database content directly within your app. Whether you need to display a list of tasks, inventory items, or customer records, the builder allows you to customize the presentation and functionality of your lists.
To configure a list in your app, start by opening the app in the app builder and clicking on the "+ New Screen" button. Next, select the desired Notion database from the dropdown menu and choose between "View Item" or "Update Item" screen types. Once you have made your selection, confirm by clicking "Done" to add the screen to your app. This will integrate the selected database into your app, allowing you to manage or view items as needed.
Choose from multiple view types and utilize features such as in-app filtering, sorting, searching, and visibility logic. These options enhance the user experience by allowing dynamic interaction with the data directly within the app.
Pros
You can customize the lists with different views, and enable them with filtering, sorting, searching, and even QR scanning.
Use the drag-drop interface with 25+ components to configure how properties can be edited or viewed.
Cons
No charts component
Top Features
No-code app builder
Cross-platform
User-specific data
Enable login
Real-time updates
Top Use Cases
Client portals
Member portals
Student portals
Partner apps
Bug trackers
Field apps
Pricing
Free plan available
Paid plan starts from $25/mo
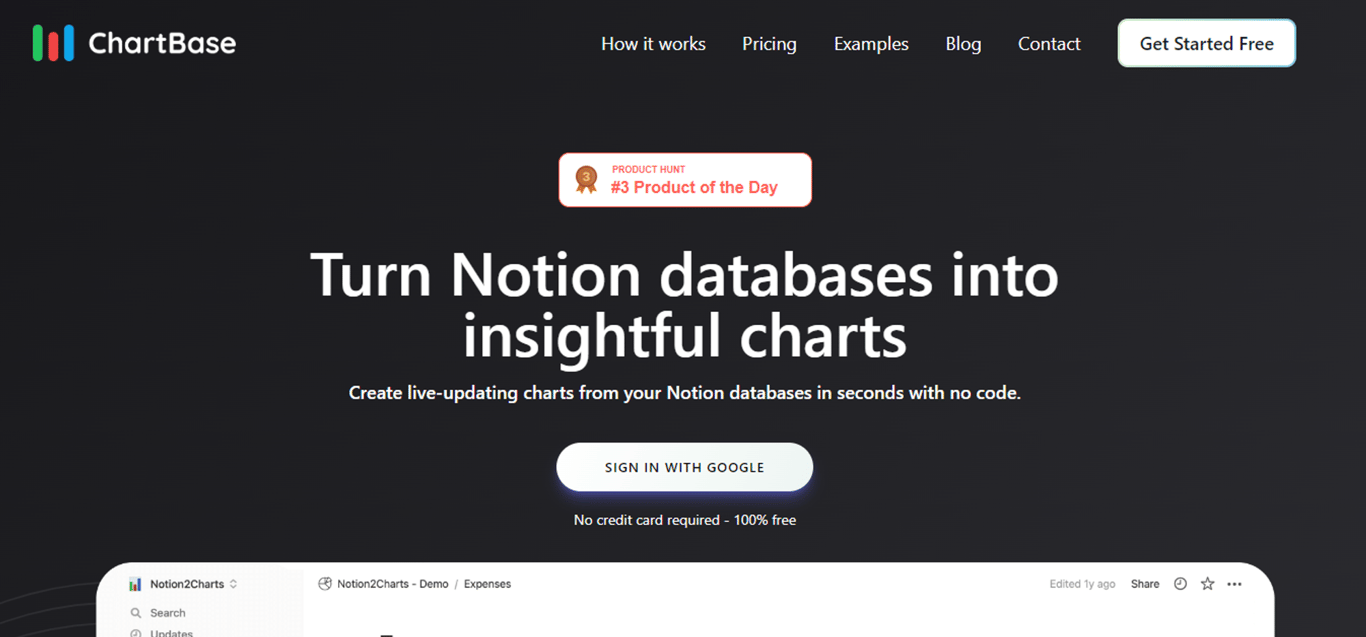
ChartBase
ChartBase is one of the most popular tools for creating charts from your Notion data without any coding required. Whether you're a small business owner, or part of a large corporation, ChartBase offers the perfect solution for visualizing your Notion data.
To transform your data with ChartBase, start by connecting your Notion account to access your tables and databases. Select the desired table or database and choose from various chart types, customizing with your branding and colors. Finally, embed your chart into Notion or any website, or export it as a high-quality image or PDF, ensuring easy sharing and up-to-date visualizations. Privacy is a top priority for ChartBase. Your data is private by default, and the platform only has access to the tables you choose to share. Choose from 7+ chart types, apply custom branding and color schemes, and adjust axis labels and legends to tailor your charts to your specific needs. The charts are responsive, adapting to any screen size, whether it’s a desktop, tablet, or mobile device. An optional $ 3/mo paid plan enables advanced features.
Pros:
Cached charts for faster loading
Real-time updates
Cons:
Only 1 free chart
Top Features
Custom branding
Sorting & filtering
Easy sharing and exporting
Responsive
Use Cases
Track budget
Track sales
Track student performance
Track habits
Track website traffic
Track marketing campaigns
Pricing
Free for 1 chart
Paid plan from $3/mo
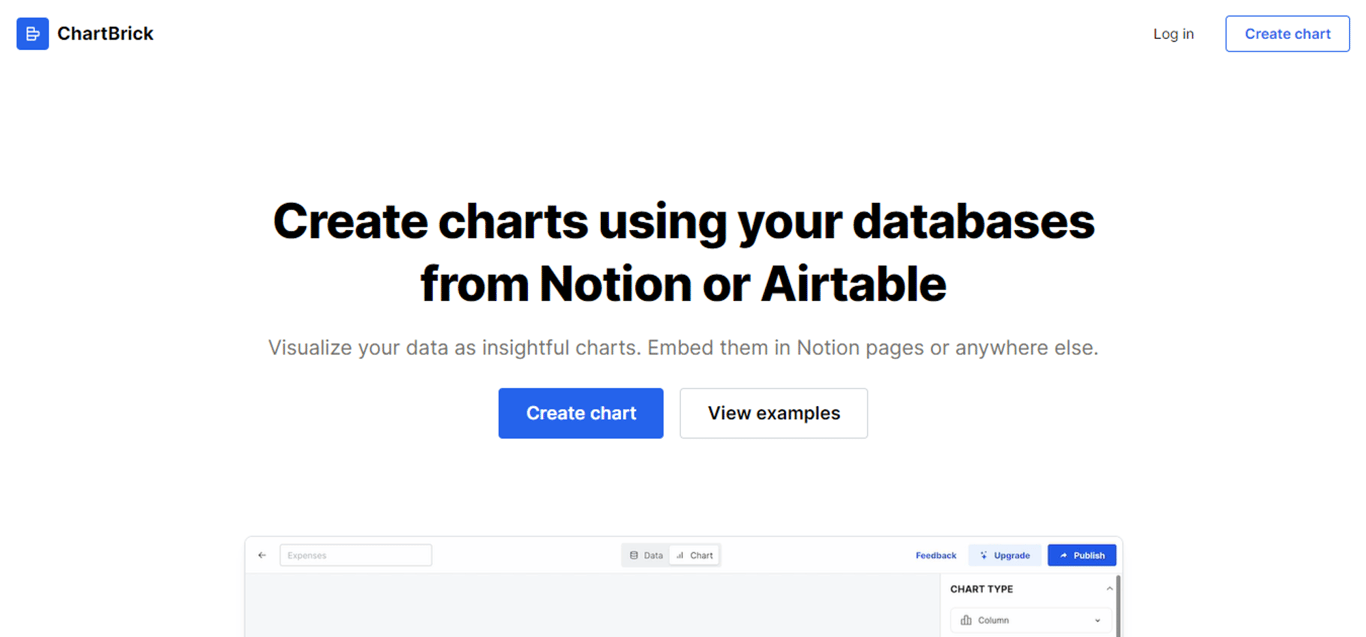
ChartBrick
ChartBrick allows you to visualize your data from Notion as insightful charts and make it more understandable. You can also download these charts as images and embed them in Notion pages, websites, or anywhere else. It also works with your data from Airtable, Stackby, MySQL, CSV, and JSON.
To get started, select a data source with ChartBrick’s easy integration, then customize your chart by choosing from eight different types—column, bar, line, area, pie, donut, radar, and funnel—and personalize it with themes, dark mode, and more. Once your chart is ready, you can embed it anywhere or download it for use in reports or presentations, ensuring it looks great on any screen size. ChartBrick prioritizes your privacy by not storing any data and ensures real-time updates for accurate insights. Its highly customizable options allow you to aggregate, filter, and sort your data, with multiple themes.
Pros:
Aggregate, filter, and sort your tables
Great customer support
Cons:
No templates to start from
Top Features
8 chart types
Real-time
Aggregate & sort
Responsive
Use Cases
Expense tracker
Track sales
Track client data
Track habits
Track website traffic
Track marketing campaigns
Pricing
Free for 3 charts
Paid plan from $8.99/mo
Notion.vip
Notion VIP Charts is a tool that allows you to create charts but uses a middle step to sync data through a Google sheet. To begin, connect your Google Sheet by copying the document ID from the URL and sharing your sheet for viewing or editing. Specify the sheet name and data range to structure your data appropriately. Next, customize your chart by selecting the type and adjusting settings like legend positions to suit your needs. Finally, enhance the visual appeal by selecting up to nine colors from Notion’s palette and choosing between Light and Dark Mode to match your Notion page’s aesthetic. As Notion VIP uses Google Sheets to populate your data, you can utilize powerful add-ons like Google Analytics and Supermetrics to keep your data up-to-date. It is specifically designed to work perfectly with Notion’s embed blocks. Your charts will automatically respond and adjust as you resize your Notion blocks, providing a smooth and integrated user experience.
Pros:
Ad-ons like Google Analytics and Supermetrics
Setup can be done directly from the homepage
Cons:
It relies on Google Sheets as an intermediary step to sync data, while now you can use the Notion API directly.
Top Features
Dark mode
Real-time
Analytics integrated
Responsive
Use Cases
Income tracker
Track subscriber growth
Track website traffic
Track revenue growth
Track sales
Track marketing campaigns
Pricing
Free
Nochart
Looking for a quicker way to visualize your Notion data? Take the artificially intelligent shortcut with Nochart. It’s AI lets you create Notion charts when you are running out of inspirations. By analyzing the various properties you've set within your database, it suggests different chart options that best suit your data. Whether you're looking to sum earnings per customer or analyze any other aspect of your data, Nochart simplifies the process.
Nochart ensures that your charts look great and are easily embeddable on any page, whether it's a public document or a private workspace. Utilizing Notion's API, it authenticates with your Notion account, granting it access to the specific database from which you want to generate the chart. This authentication process ensures a seamless connection, allowing you to visualize your data directly within Notion.
Pros:
Create your notion chart using human language and AI
Order your chart and filter on a column in your database
Cons:
Minimal features as in the Beta version
Top Features
AI integrated
Customization
Privacy first
Embeddable
Use Cases
Budget tracker
Freelance time tracker
Sales CRM
Reading list
Expense tracker
Track marketing campaigns
Pricing
Free for 2 charts
Paid plan from $9.99/mo
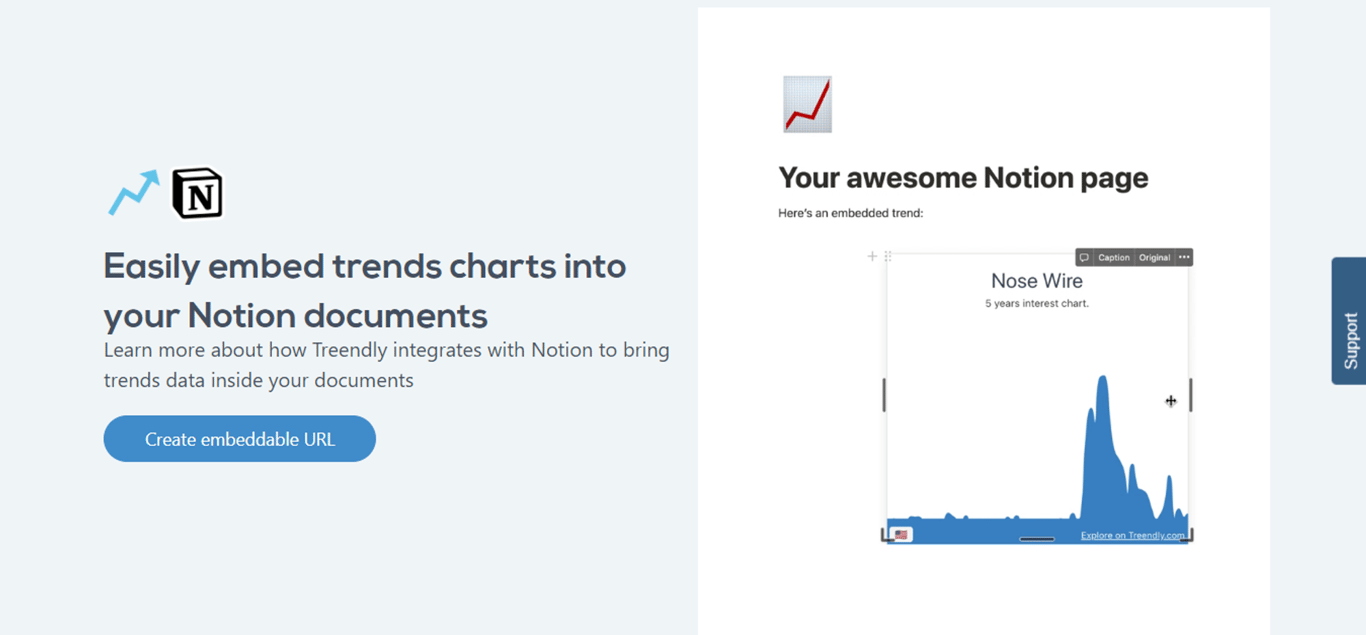
Treendly
Integrating Treendly with Notion enables you to make data-driven decisions by embedding real-time trend charts and insights directly into your Notion documents. By entering a search term or topic, such as “tech", you can create a trend chart for your Notion pages, offering insights into the latest trends across different countries and industries over the past few years. You can search for your topics and easily get an indication of their trend and monthly search volume. You can also monitor how a keyword or topic performs over time and receive alerts when it starts trending, with updates as frequent as weekly. Save and monitor these trends over time in your private area, ensuring you stay ahead of the curve. Treendly's technology is based on a robust 4-step process: sourcing heavily searched topics by monitoring high-quality sources, using mathematical analysis to assess their relevance as trends, enriching the data by collecting related topics and microdata, and forecasting their likely performance soon based on historical data.
Pros:
Build your own private library of trends
Search a keyword in any country or industry and see how likely it is to perform
Cons:
No ability to access custom reports for basic users
Top Features
New & curated trends
Monitor keywords
Related keywords
Forecasting
Use Cases
E-commerce owner
Affiliates
Marketers
SEO expert
Venture Capitalist
Software engineer entrepreneur
Pricing
Free with limited features
Paid plan from $49/mo
Datajumbo
DataJumbo for Notion is a powerful tool that transforms your Notion databases into insightful charts and graphs. With DataJumbo, you can easily create a wide range of chart types, including bar charts, KPIs, line charts, calendars, waffle charts, and radar charts, making it simple to extract insights and keep track of your data in your dashboards.
Using DataJumbo is straightforward. First, create a DataJumbo account and connect it to your Notion workspace. Next, build your chart by selecting a chart type and configuring it to suit your needs. Finally, copy and paste a link to import the chart as an embed right into your Notion workspace. With DataJumbo, visualizing and understanding your Notion data has never been easier. When your database contains over 500, Data Jumbo automatically switches your chart to cached mode. Data Jumbo will load a copy of your data which is securely stored on their server. It’s great because it fetches the latest data in a few seconds instead of minutes. This copy is always kept up to date, if you update anything in your Notion database it will update it in your chart.
Pros:
Advanced features like bucket by, split on top of sort, and filters
Supports heavy databases with their cached mode
Cons:
No automatic updates
Top Features
Add functions
Customization panel
Countless chart types
Dark mode
Use Cases
Budget planning
Business tracker
Habit tracker
Life goals tracker
Expense tracker
Team goals tracker
Pricing
Free for 3 charts
Paid plan from $5/mo
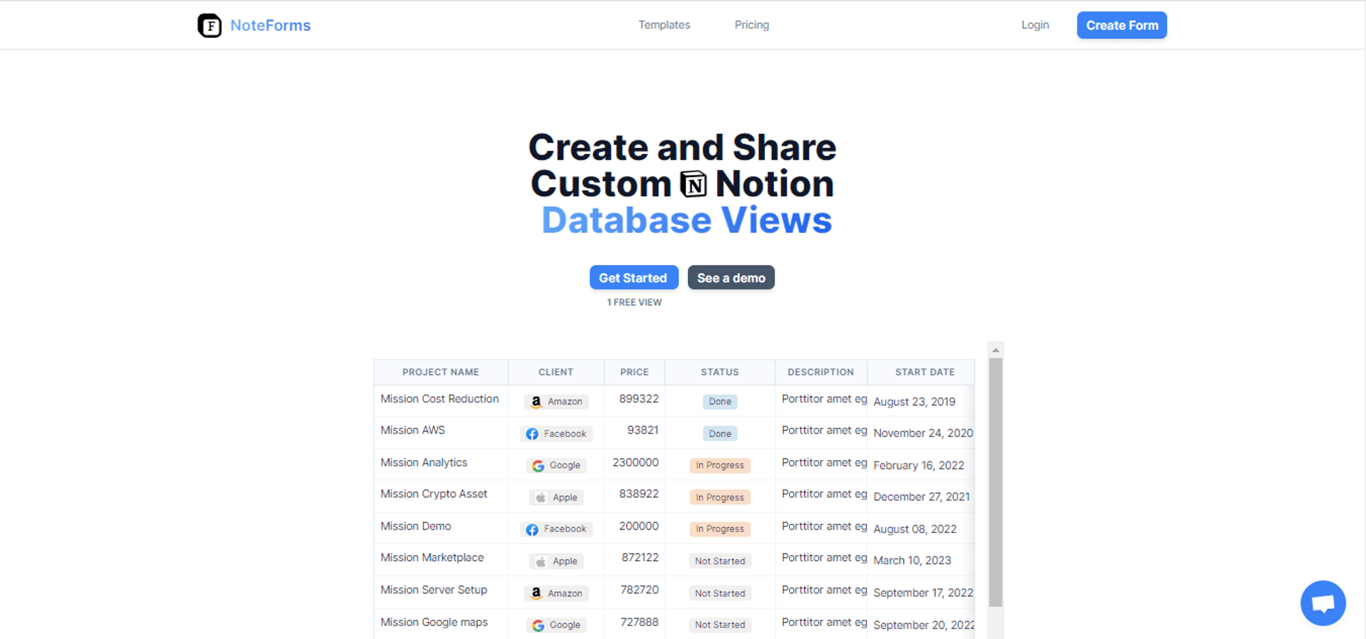
Noteforms
NoteForms allows you to share only the parts of your database you need, making it the perfect solution when Notion permissions aren't enough. No more duplicating Notion databases multiple times for each customer or client.
To get started, register and connect your Notion workspace with NoteForms. Once connected, you can create a database in Notion and add as many columns as you need. Then, create a view by selecting the database, filtering out irrelevant rows, and customizing the table and columns. With NoteForms, you can hide columns containing private information, apply filters to share only relevant data and sort your data by any column in any order. You can also customize the appearance by changing colors, and fonts, and even injecting custom code.
NoteForms ensures your data is safe by allowing you to protect your database views with a password. You can share your NoteForms database views anywhere by embedding them within your Notion pages or on external websites.
Pros:
No more duplicating databases
Hide away the information that should remain private.
Cons:
Restricted to database views only
Top Features
Hide columns
Sort & filter data
Protect with password
Share everywhere
Pricing
1 free view
Paid plan from $20/mo
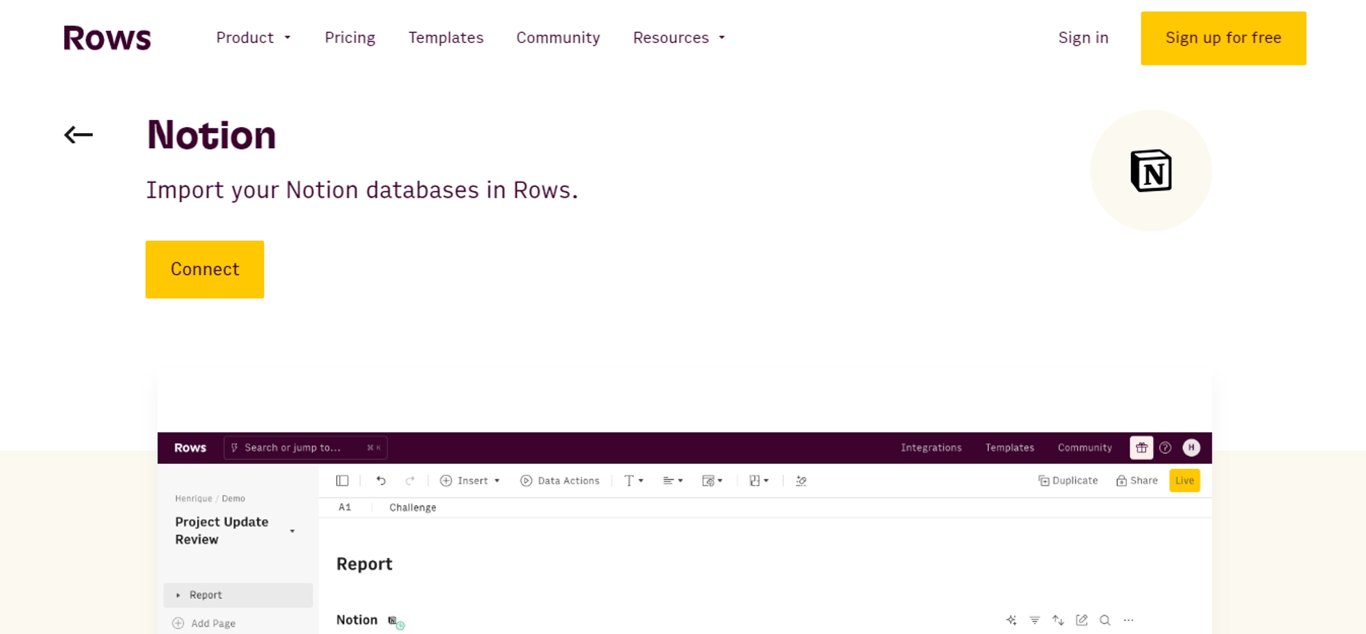
Rows
Rows is a web application for creating modern, beautiful, and functional spreadsheets. It’s Notion integration, gives you the power to import Notion databases to analyze and transform data to build business reports, all in a spreadsheet.
You can create gorgeous charts that not only enhance your reports visually but also help you tell better stories with your data. Designed for simplicity, Rows includes a guided wizard that makes using formulas easy, even if you're not a spreadsheet expert.
Beyond numbers, Rows allow you to make your spreadsheets interactive with buttons, input fields, and date pickers. Additionally, Rows integrates the power of GPT-3, enabling you to use AI to create lists of data, answer questions, classify customer feedback, translate text, and much more.
Pros:
Integrated with the power of GPT-3
Create more than charts like large tables, calculators
Cons:
The limited size of the graphs makes them look cluttered
Top Features
Add Functions
Automation
Convert tables to forms
AI co-pilot
Use Cases
Investment portfolio tracker
Social media tracker
Business financial reports
Project timeline tracker
Personal finance tracker
Bug tracker
Pricing
Free plan available
Paid plan from $15/mo
Columns
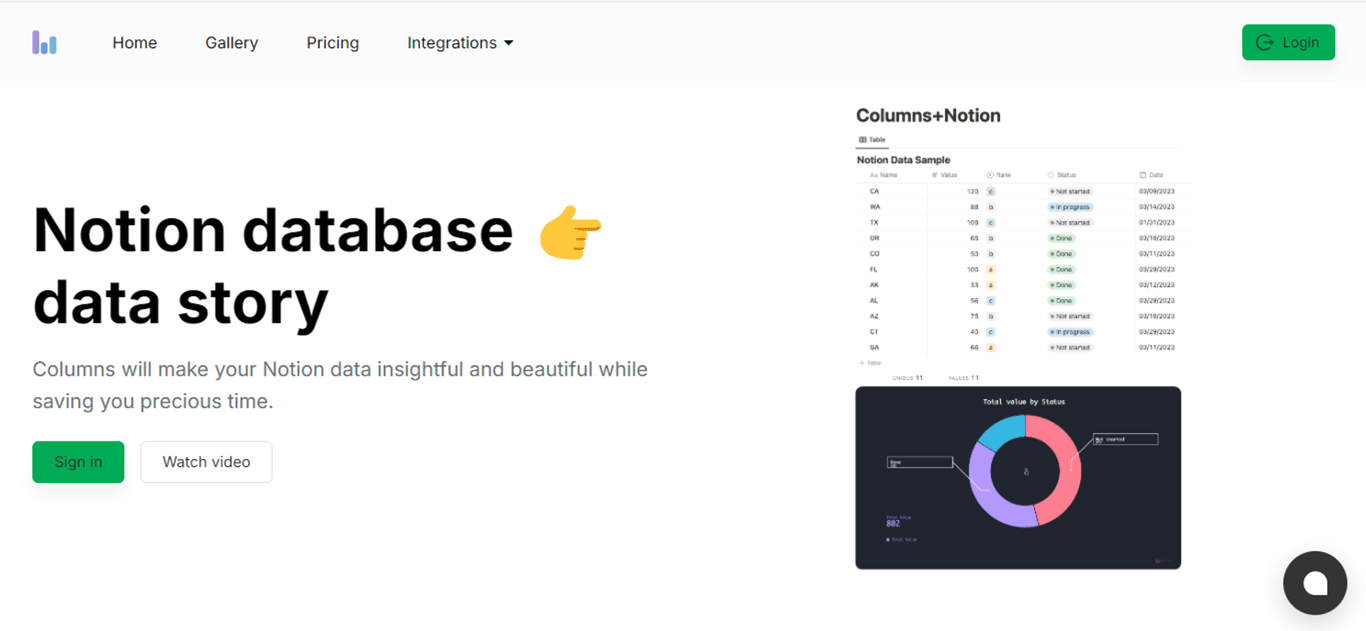
Columns.ai integrates with Notion using what they call a "full loop" method. Simply build your story on Columns, embed it back into your Notion page, and set up automatic updates for a dynamic and live experience. When you connect your Notion database to Columns, you unlock a bunch of features to sync your data and graphs without any hassle.
Columns.ai can handle all kinds of data, even tricky stuff like formulas and time series. It uses AI to turn your raw data into compelling visual stories effortlessly.
With Columns.ai, the integration with Notion goes beyond visualization. You can easily share links, embed your content anywhere, and even create dynamic dashboards. Plus, your visuals stay synced with your data using scheduled automatic updates, so you always have the latest insights at your fingertips.
Pros:
Enjoy Columns AI to generate data insights automatically for you.
Columns have built extensive support to handle any of your data including formulas and rollups
Cons:
The free version doesn’t allow auto-sync
Top Features
2-way sync
Set up auto-updates
More ways to share
AI integrated
Use Cases
Student report
Social media tracker
Product analysis
Project timeline tracker
Personal finance tracker
Sales tracker
Pricing
Free plan available
Paid plan from $15/mo
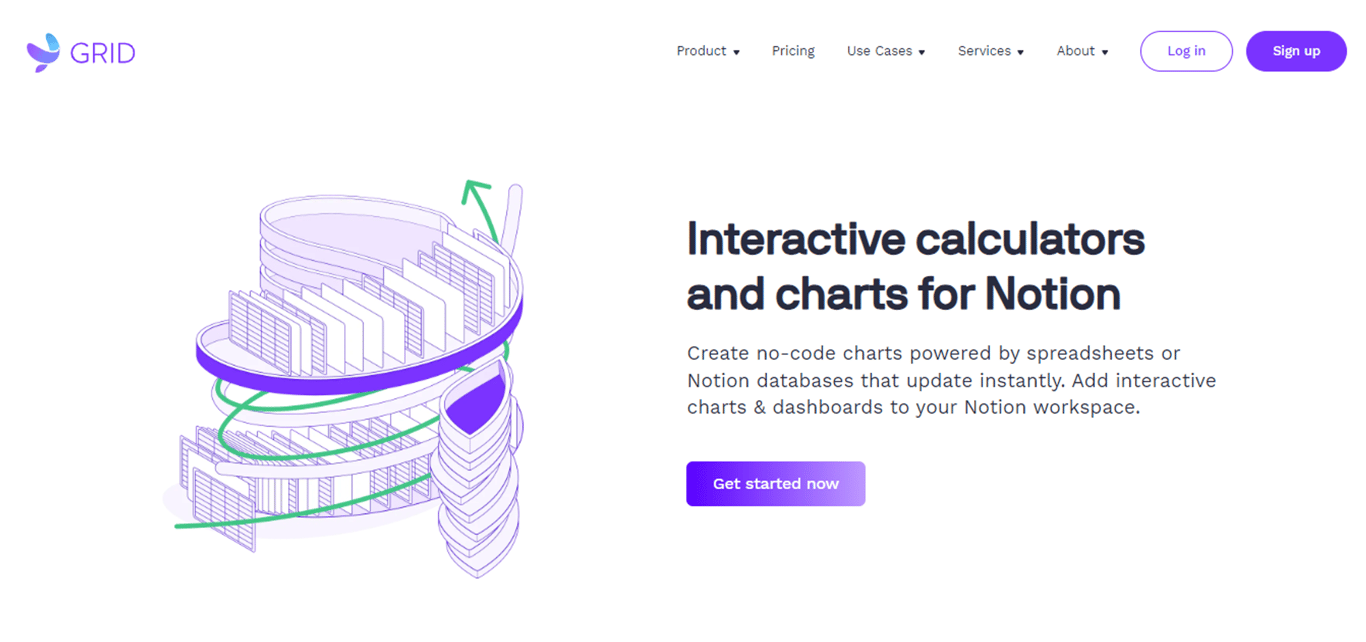
Grid
GRID lets you build interactive and dynamic charts and embed them into your Notion page using the GRID Link Preview integration for Notion.
Starting with a GRID Sheet, you can connect your Notion database or bring in data from various sources like Airtable, Google Sheets, and more. Create as many charts as you'd like and enjoy the automatic refreshment of charts and calculators. The simplest way to build a chart from your Notion database is using the Chart Builder. You’ll find it on the bottom right after you’ve connected your Notion database. GRID offers an AI Chart Assistant to generate charts from plain-language prompts, enabling you to build meaningful charts in a fraction of the time. Whether you're crafting a sales tracking template, a profit margin calculator, or a tool to generate price quotes, GRID provides the perfect platform to get started.
Pros:
AI chart assistant to easily generate charts from plain-language prompts.
Import and combine data from multiple sources in Notion
Cons:
Notion database columns/rows may appear out of order
Top Features
Built-in spreadsheet editor
Unlimited charts
Automatic updates
AI chart assistant
Use Cases
Marketing reports
Pricing calculators
Budget calculators
Boards reports
Business models
Sales tracker
Pricing
Free plan available
Paid plan from $15/mo
Conclusion
Charts in Notion are no longer a complex task, thanks to a range of third-party tools. They've made it easier to visualize data and enhance project management. These tools offer a variety of options to suit different needs.
Whether you're seeking a user-friendly approach, dynamic chart transformations, advanced data visualization, or specialized integration, there's a tool for you. With free and premium plans available, you can choose the level of data power that fits your projects. So, it's time to simplify your Notion experience and start embedding charts with ease.
While tools like Super, Bullet, and NotionApps have been popular for creating websites and apps, Notion Sites offers a quick solution for simpler needs. This comprehensive review compares Notion Sites with Notion Website Builders, Blog Builders, and Web App Builders to help you pick the right tool. Whether you need a personal site, professional page, company blog, or client portal, we’ve got you covered.
Notion is the best tool for note-taking, but it does not have built-in forms. There's a variety of no-code tools that allow us to create beautiful forms to send responses straight to Notion databases. These tools are designed to be easy to use, allowing you to customize your forms to suit your needs. You can effortlessly embed your forms into any Notion page, use app integrations and conditional logic, and ensure that your data stays up-to-date in real time. With features like form protection, you can keep your data secure too. In this article, we have talked about 10 tools that help you collect tens of thousands of submissions across dozens of forms with flexibility and security.
Notion is perfect for creating content, so why not use it to build your website too? In this post, we compiled 9 no-code tools that turn Notion into a CMS, allowing you to easily create and manage websites. Showcase your portfolio, launch a blog, or collaborate on projects without needing to code.